Stock chart patterns are an important trading tool that is used in the frame of the technical analysis when looking for market trends and predicting movements. They can be used to analyze all markets including Forex, shares, commodities and more.

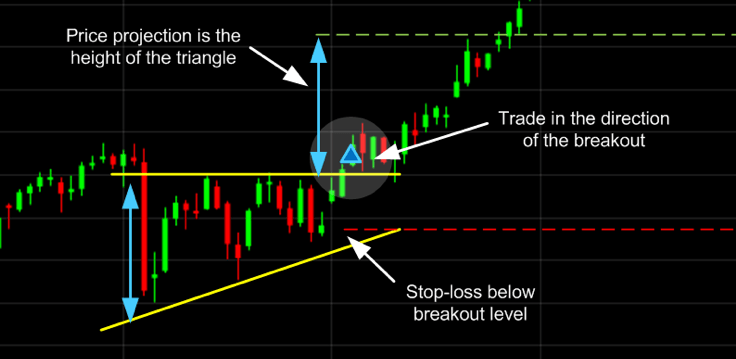
1. Ascending triangle
The ascending triangle is a bullish ‘continuation’ chart pattern that signifies a breakout is likely where the triangle lines converge. To draw this pattern, you need to place a horizontal line (the resistance line) on the resistance points and draw an ascending line (the uptrend line) along the support points.
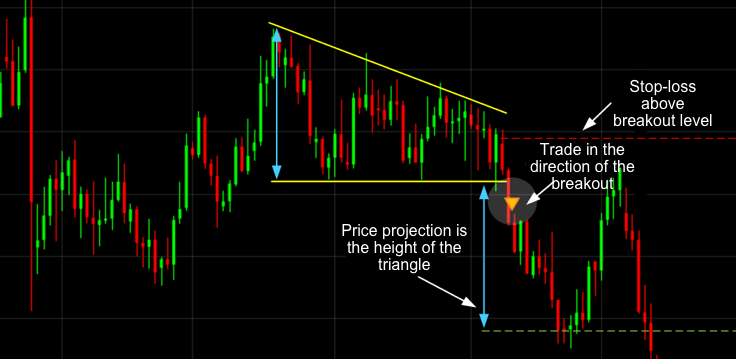
2. Descending triangle
Unlike ascending triangles, the descending triangle represents a bearish market downtrend. The support line is horizontal, and the resistance line is descending, signifying the possibility of a downward breakout.
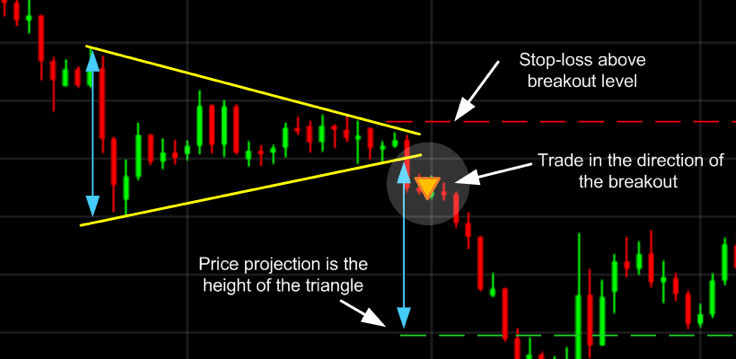
3. Symmetrical triangle
For symmetrical triangles, two trend lines start to meet which signifies a breakout in either direction. The support line is drawn with an upward trend, and the resistance line is drawn with a downward trend. Even though the breakout can happen in either direction, it often follows the general trend of the market.
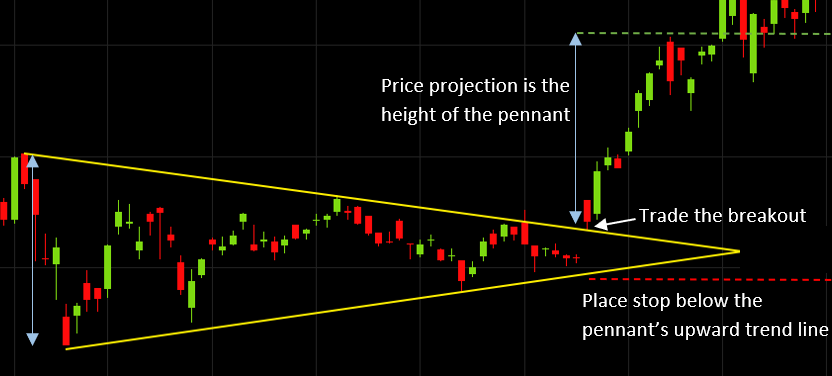
4. Pennant
Pennants are represented by two lines that meet at a set point. They are often formed after strong upward or downward moves where traders pause and the price consolidates, before the trend continues in the same direction.
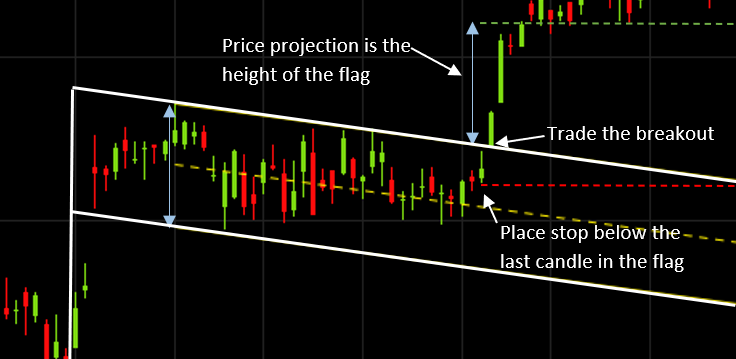
5. Flag
The flag stock chart pattern is shaped as a sloping rectangle, where the support and resistance lines run parallel until there is a breakout. The breakout is usually the opposite direction of the trendlines, meaning this is a reversal pattern.
6. Wedge
A wedge pattern represents a tightening price movement between the support and resistance lines, this can be either a rising wedge or a falling wedge. Unlike the triangle, the wedge doesn’t have a horizontal trend line and is characterized by either two upward trend lines or two downward trend lines.
For a downward wedge, it is thought that the price will break through the resistance and for an upward wedge, the price is hypothesized to break through the support. This means the wedge is a reversal pattern as the breakout is opposite to the general trend.
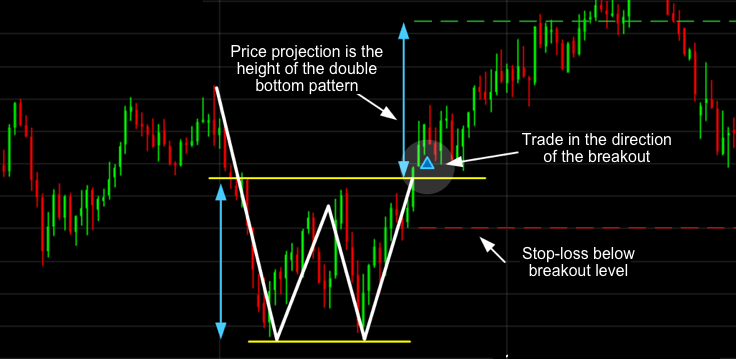
7. Double bottom
A double bottom looks similar to the letter W and indicates when the price has made two unsuccessful attempts at breaking through the support level. It is a reversal chart pattern as it highlights a trend reversal. After unsuccessfully breaking through the support twice, the market price shifts towards an uptrend.
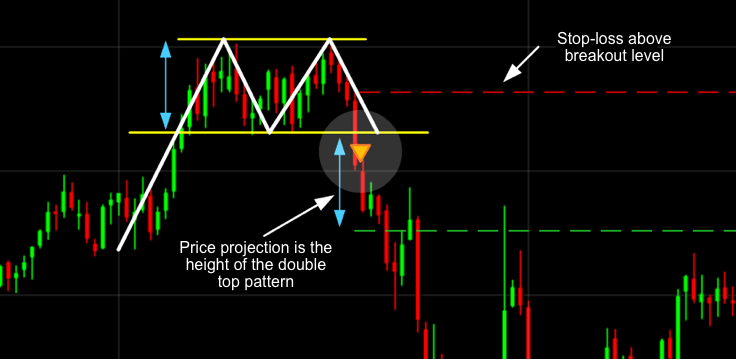
8. Double top
Opposite to a double bottom, a double top looks much like the letter M. The trend enters a reversal phase after failing to break through the resistance level twice. The trend then follows back to the support threshold and starts a downward trend breaking through the support line.
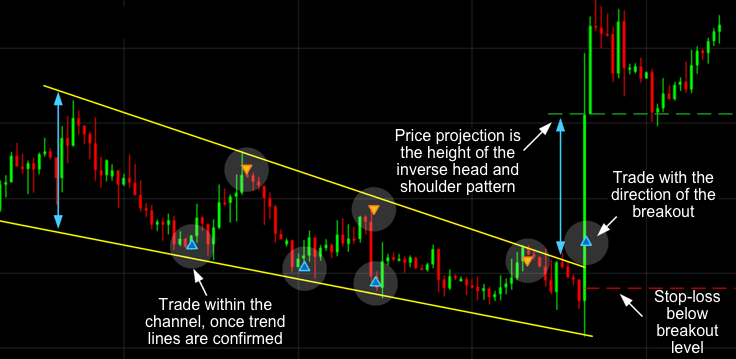
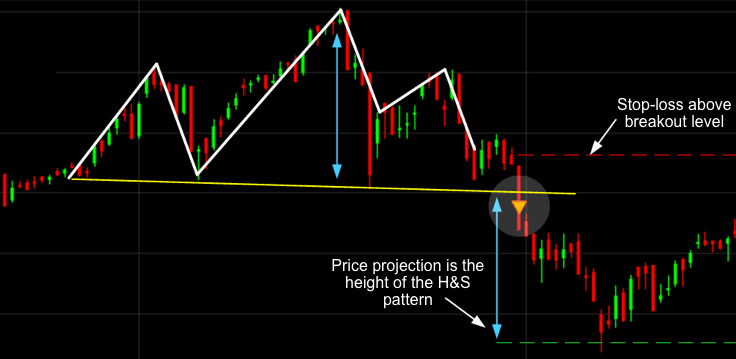
9. Head and shoulders
The head and shoulders pattern tries to predict a bull to bear market reversal. Characterized by a large peak with two smaller peaks either side, all three levels fall back to the same support level. The trend is then likely to breakout in a downward motion.
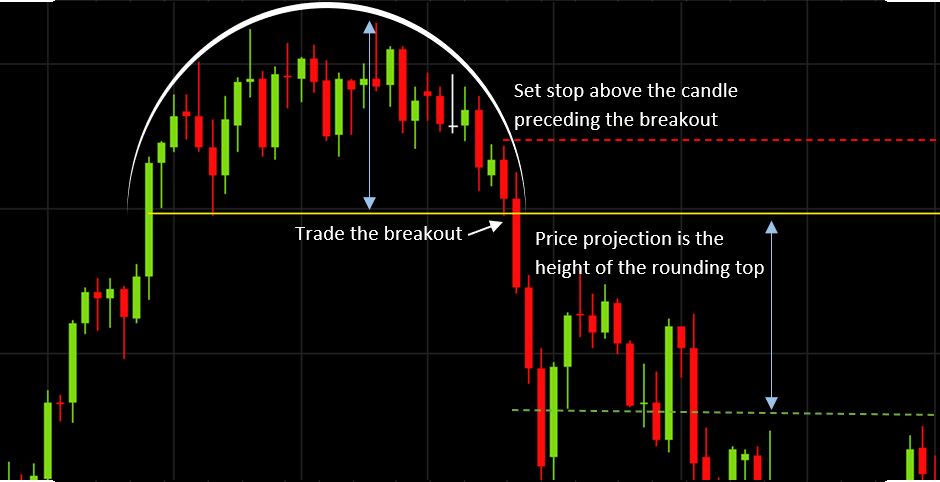
10. Rounding top or bottom
A rounding bottom or cup usually indicates a bullish upward trend, whereas a rounding top usually indicates a bearish downward trend. Traders can buy at the middle of the U shape, capitalizing on the trend that follows as it breaks through the resistance levels.
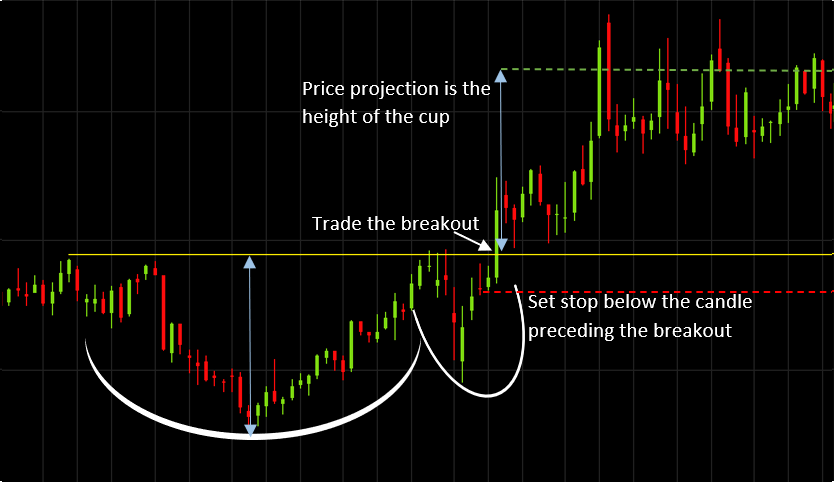
11. Cup and handle
The cup and handle is a well-known continuation stock chart pattern that signals a bullish market trend. It is the same as the above rounding bottom, but features a handle after the rounding bottom. The handle resembles a flag or pennant, and once completed, you can see the market breakout in a bullish upwards trend.
Don't forget to follow JumpFinance on:
- Youtube
Comments
Post a Comment